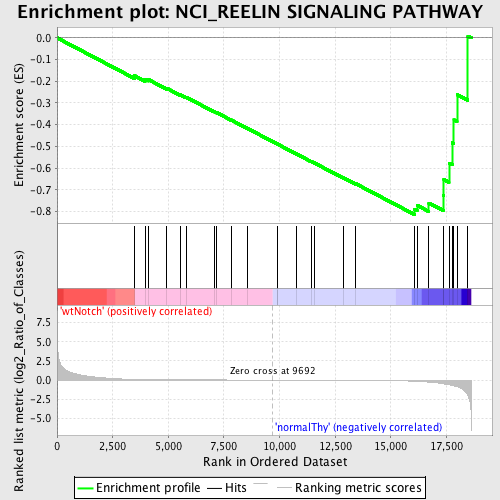
Profile of the Running ES Score & Positions of GeneSet Members on the Rank Ordered List
| Dataset | Set_03_wtNotch_versus_normalThy.phenotype_wtNotch_versus_normalThy.cls #wtNotch_versus_normalThy.phenotype_wtNotch_versus_normalThy.cls #wtNotch_versus_normalThy_repos |
| Phenotype | phenotype_wtNotch_versus_normalThy.cls#wtNotch_versus_normalThy_repos |
| Upregulated in class | normalThy |
| GeneSet | NCI_REELIN SIGNALING PATHWAY |
| Enrichment Score (ES) | -0.8137132 |
| Normalized Enrichment Score (NES) | -1.5559623 |
| Nominal p-value | 0.0065502184 |
| FDR q-value | 0.18627012 |
| FWER p-Value | 0.862 |
| PROBE | DESCRIPTION (from dataset) | GENE SYMBOL | GENE_TITLE | RANK IN GENE LIST | RANK METRIC SCORE | RUNNING ES | CORE ENRICHMENT | |
|---|---|---|---|---|---|---|---|---|
| 1 | MAPT | 360706 1230706 | 3479 | 0.087 | -0.1744 | No | ||
| 2 | ITGA3 | 4570427 | 3952 | 0.057 | -0.1914 | No | ||
| 3 | NCK2 | 2510010 | 4089 | 0.050 | -0.1914 | No | ||
| 4 | RELN | 6510037 | 4934 | 0.029 | -0.2325 | No | ||
| 5 | RAPGEF1 | 60040 4590670 | 5531 | 0.021 | -0.2616 | No | ||
| 6 | MAP2K7 | 2260086 | 5805 | 0.018 | -0.2736 | No | ||
| 7 | GRIN2B | 3800333 | 7052 | 0.010 | -0.3393 | No | ||
| 8 | PIK3R1 | 4730671 | 7181 | 0.009 | -0.3448 | No | ||
| 9 | AKT1 | 5290746 | 7820 | 0.006 | -0.3782 | No | ||
| 10 | GRIN2A | 6550538 | 8554 | 0.004 | -0.4171 | No | ||
| 11 | PIK3CA | 6220129 | 9883 | -0.001 | -0.4885 | No | ||
| 12 | LRP8 | 3610746 5360035 | 9894 | -0.001 | -0.4889 | No | ||
| 13 | PAFAH1B1 | 4230333 6420121 6450066 | 10752 | -0.003 | -0.5346 | No | ||
| 14 | RAP1A | 1090025 | 11438 | -0.006 | -0.5706 | No | ||
| 15 | VLDLR | 870722 3060047 5340452 6550131 | 11548 | -0.006 | -0.5756 | No | ||
| 16 | DAB1 | 2060193 7000605 | 12872 | -0.013 | -0.6449 | No | ||
| 17 | ARHGEF2 | 3360577 | 13426 | -0.017 | -0.6721 | No | ||
| 18 | MAPK8 | 2640195 | 16060 | -0.156 | -0.7908 | Yes | ||
| 19 | FYN | 2100468 4760520 4850687 | 16182 | -0.174 | -0.7718 | Yes | ||
| 20 | ITGB1 | 5080156 6270528 | 16711 | -0.267 | -0.7609 | Yes | ||
| 21 | CDK5 | 940348 | 17354 | -0.483 | -0.7244 | Yes | ||
| 22 | LRPAP1 | 5570253 | 17385 | -0.495 | -0.6531 | Yes | ||
| 23 | GSK3B | 5360348 | 17615 | -0.598 | -0.5775 | Yes | ||
| 24 | MAP3K11 | 7000039 | 17763 | -0.692 | -0.4837 | Yes | ||
| 25 | CBL | 6380068 | 17838 | -0.744 | -0.3782 | Yes | ||
| 26 | CRKL | 4050427 | 17976 | -0.847 | -0.2610 | Yes | ||
| 27 | CDK5R1 | 3870161 | 18465 | -2.008 | 0.0081 | Yes |

